When on the hunt for a new home, there are a few key considerations prospective buyers tend to keep in mind. Is the property feasibly within their budget? Does it, and the surrounding neighbourhood, have the amenities they need? What will the commute to and from work be like? The selling price of comparable nearby properties is also an important factor to note when developing an offer strategy.
However, there is another metric that can be extremely helpful for home buyers to be aware of – a market’s sales-to-new-listings ratio (SNLR). This ratio is calculated by dividing the number of sales by the number of new listings brought to market over a specific time frame (such as the month of June), in a specific housing market.
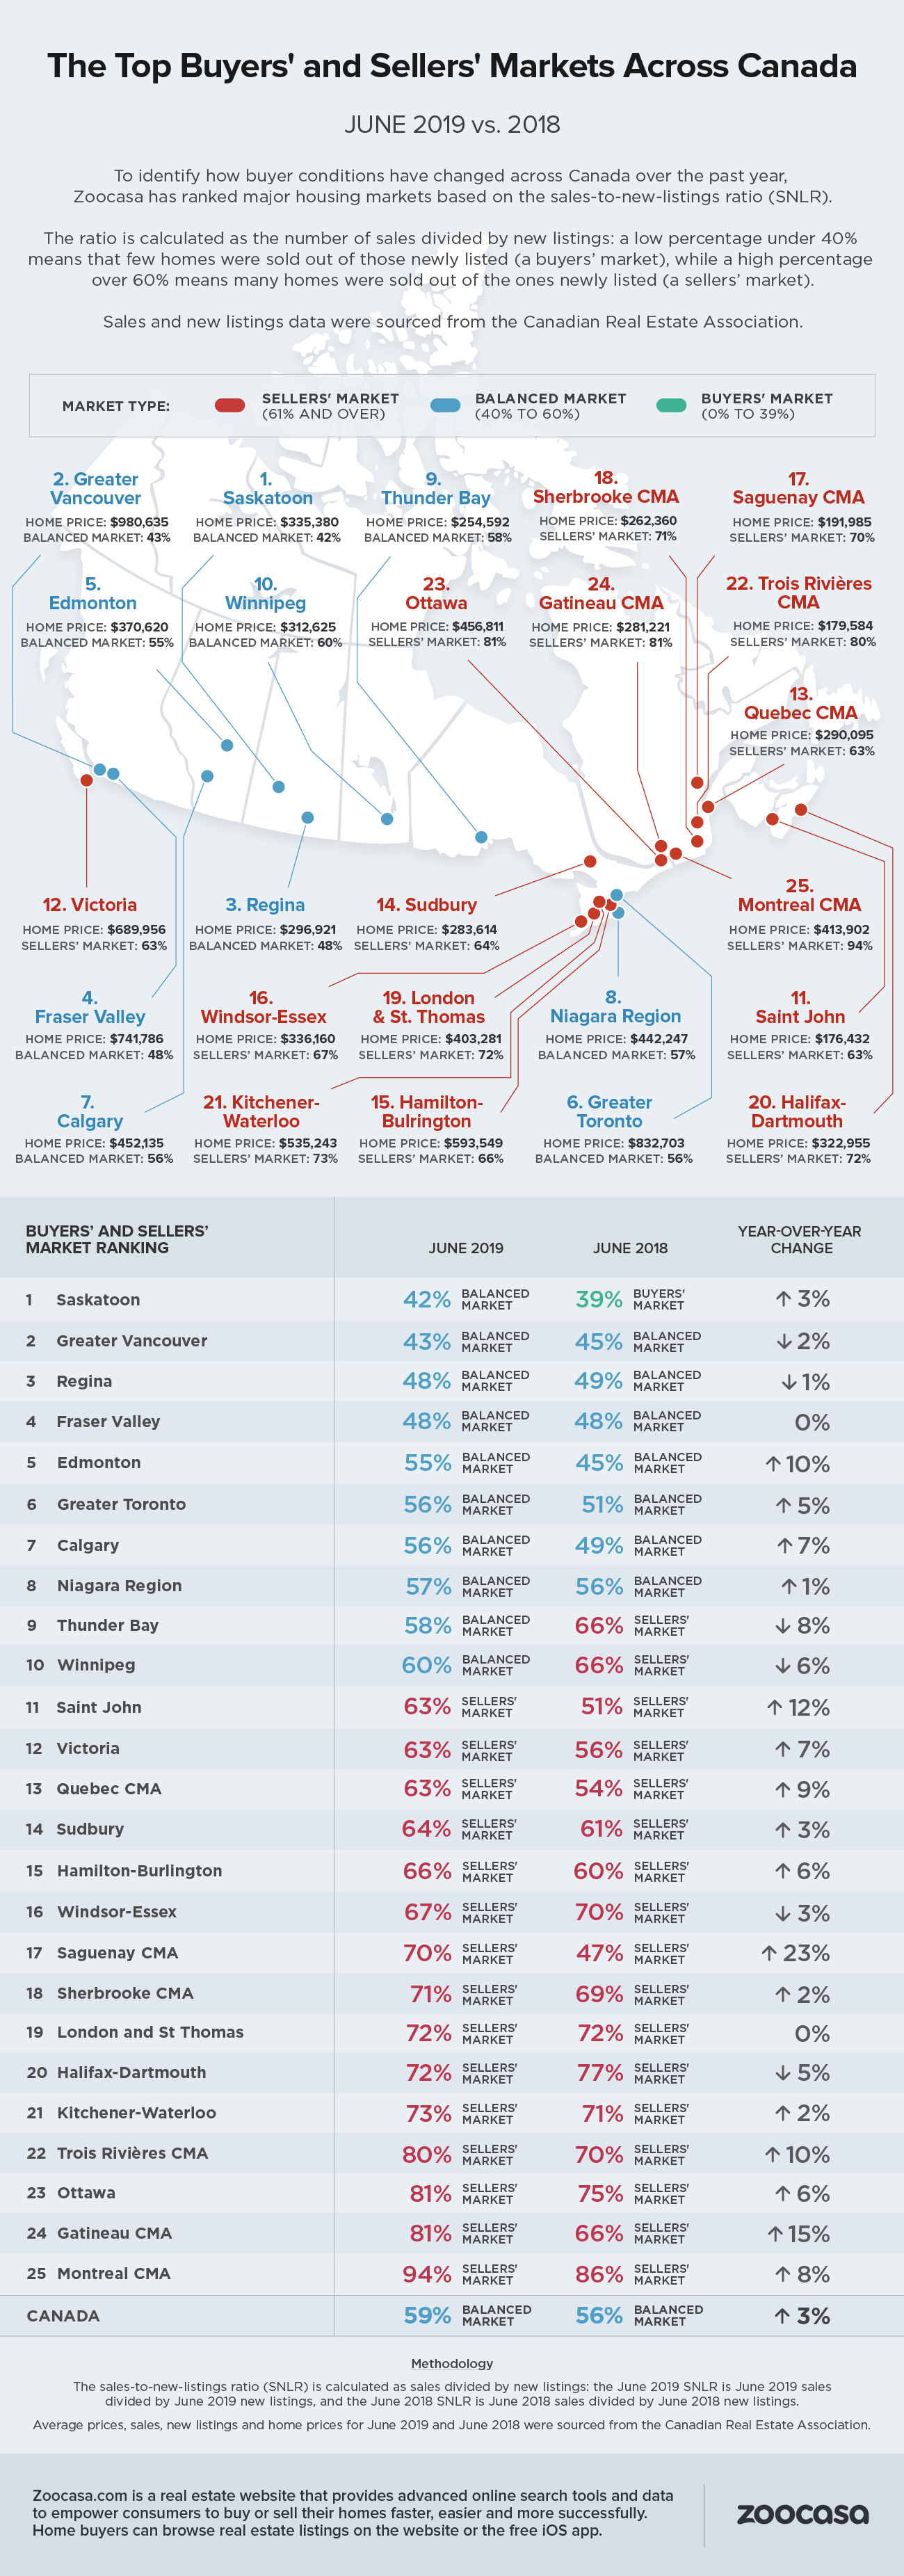
What the SNLR illustrates is the level of competition in that housing market: is there enough supply to satiate demand? Are the majority of newly-listed homes being snapped up by buyers, or are they languishing on the market? We can tell by looking at the ratio percentage – a range between 40 – 60% indicates a balanced market, while above and below that threshold reveal sellers’ and buyers’ markets, respectively.
This gives home buyers some great insight as to how they need to set their budget and expectations before embarking on the house hunt. Those entering a sellers’ market, for example, can expect to encounter more multi-offer situations, which can drive home prices up. As a result, these buyers should expect that it may take multiple attempts to win their desired home, and that they may need to increase their budget and be more aggressive with their offer strategy. Someone looking to purchase a home in a buyers’ market will have a larger supply of homes to choose from, are less likely to engage in a bidding war, and may have more leverage with the seller when making an offer.
Another great aspect of the SNLR is that it can apply to any geographical region. For example, the SNLR for all of Canada in June was 59%, according to data compiled by Zoocasa – still considered balanced, but hovering on the brink of seller-friendly conditions.
It’s a different picture, however, at the local level; the study, which calculated the SNLR for 25 major urban markets across the nation found that, currently, none of Canada’s large cities qualify as a buyers’ market. A total of 15 are within sellers’ territory, while the remaining 10 are at various levels of balanced.
So, what kind of market conditions can home buyers expect in Canada’s major markets? The study finds that the hottest sellers’ markets are actually concentrated in eastern Ontario and Quebec – Montreal takes the top spot with a scalding ratio of 94%, indicating almost all new supply brought to market in June sold. That’s followed by Gatineau and Ottawa, each with a ratio of 81%. What these markets all have in common is their relatively affordable average home price – single-family houses for sale can be purchased for less than $500,000 in each.
However, Canada’s largest cities – namely the Toronto and Vancouver real estate markets – find themselves on the lower end of balanced. Greater Vancouver is actually the second-softest market in the nation with a ratio of 43%, following what has been a dramatic correction over the last year; sales have fallen -15% in the west coast city as it has absorbed the impact of the federal mortgage stress test, along with a few provincial policies designed to cool the market.
Toronto finds itself in sixth place with a ratio of 56% – still balanced, but indicating some of the supply and demand imbalances are returning to the market; sales rose a steep 10% in June, well outpacing the flat supply of new listings.
Check out the infographic below to see which housing markets were most and least competitive in June, and how they compared to the same time period in 2018.
Penelope Graham is the Managing Editor at Zoocasa.com, a real estate website that provides advanced online search tools and data to empower consumers to buy or sell their homes faster, easier and more successfully. Home buyers can browse real estate listings, as well as sold house prices in Toronto, on the website or the free iOS app.
YOUR FREE FINANCIAL PLAN
Are you ready to invest in your future?
Build your free plan today.
Start now

Sometimes unexcpected expenses can leave you with bad credit, but the good news is even with poor credit you can still qualify for a mortgage.

Sometimes unexcpected expenses can leave you with bad credit, but the good news is even with poor credit you can still qualify for a mortgage.

The Manulife One Mortgage is an all-in-one tool combining your mortgage, savings, and income into one easy-to-use account. Find out if it's right for you.